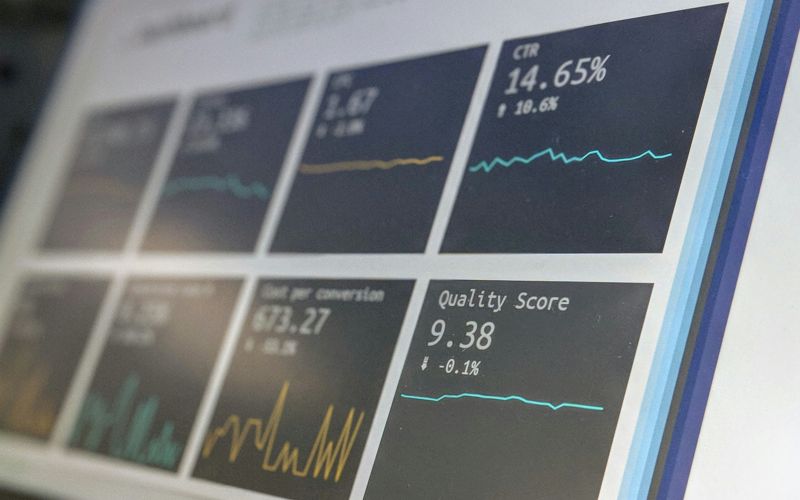
Once a CRM is live, the question comes quickly: is it working? Too often the answer stops at login figures. Logins show that people open the system, not that it creates value. A balanced set of indicators gives a far more useful picture.
Adoption KPIs
Measure how the CRM is actually used: active users per team, opportunities updated in the last week, activities logged per rep, use of key features such as mobile or forecasting. Compare teams and regions to spot where support is needed.
Data quality KPIs
Reliable data is the condition for everything else. Track the completeness of key fields, the number of duplicates, opportunities with close dates in the past and accounts without an owner. These indicators often explain why reports aren't trusted.
Business KPIs
Ultimately, the CRM should support business results: pipeline coverage, win rates, sales cycle length, forecast accuracy, service response times, customer satisfaction. The CRM rarely explains these on its own, but it should make them visible and help improve them.
From KPIs to action
Choose a limited set, around ten to fifteen indicators, agreed with business leaders. Build dashboards per audience: executives need trends and outcomes, managers need team views to coach their people, admins need data quality detail.
Above all, use the dashboards in real meetings. When pipeline reviews and management meetings run from the CRM, adoption and data quality improve naturally, because the data suddenly matters.